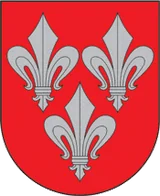

Municipality · Tauragė CountyCoat of arms of Jurbarkas District MunicipalityFlag of Jurbarkas District Municipality

Jurbarkas District Municipality: population and statistics

Jurbarkas District Municipality has a population of 25,132 (2025) across 1,507.0 km², or 16.7 people per km². It ranks 32 of 60 municipalities by population. Its population is falling: −11.6% between 2015 and 2025.

  • 25,132 residents
  • 1,507.0 km²
  • 17 people/km²
  • 58 m
View of Jurbarkas District Municipality
Photo: Watas, CC BY-SA 4.0, Wikimedia Commons

Key points

Among the 4 municipalities in Tauragė County, Jurbarkas District Municipality ranks No. 2 by population.

Road accidents with injuries or deaths per 10,000 inhabitants (annual average): 4.5 in Jurbarkas District Municipality, compared with an average of 8.7 in Tauragė County and 9.9 nationally.

A 1 kWp solar panel tilted at 40° generates about 1,008 kWh a year here.

Did you know?

Jurbarkas District Municipality in numbers

Population
25,132
ranked 32 of 60
−11.6%over 10 years
2015–2025
Population density
17people/km²
ranked 42 of 59
Area
1,507km²
ranked 13 of 59
Elevation
58m
ranked 42 of 60
Room occupancy rate in hotels and similar establishments
2.8%
ranked 55 of 55
Road accidents with injuries or deaths per 10,000 inhabitants (annual average)
4.5
ranked 59 of 60
Mean daily temperature range: daily maximum minus daily minimum (1991–2020 normal, estimate)
7.2°C
ranked 1 of 60
Pre-school establishments per 1,000 children under 15
1.1per 1,000 children under 15
ranked 54 of 58

All indicators for Jurbarkas District Municipality

Value for the municipality, then the regional average and the national median (for counts: regional and national totals). The gauge places the municipality between the lowest and highest value in the country.

Jurbarkas District MunicipalityNational medianHover over or tap a bar to see what it shows.

Population

IndicatorJurbarkas District MunicipalityTauragė CountyNationalPosition?Rank
Share of population under 15 (2025)10.8%12.7%12.4%ranked 51 of 60
Share of population aged 65 and over (2025)23.4%22.5%23.3%ranked 27 of 60
Share of women (2025)49.8%51.8%52.6%ranked 55 of 60
Median age of the population (2025)47.0 years–47.5ranked 31 of 60
Birth rate (births per 1,000 inhabitants) (2024)5.3 ‰6.4 ‰5.6 ‰ranked 36 of 57
Degree of urbanisation (1 city, 2 town or suburb, 3 rural area) (2024)3–3ranked 1 of 60

Energy

IndicatorJurbarkas District MunicipalityTauragė CountyNationalPosition?Rank
Wind turbines (OpenStreetMap) (2026)40172725ranked 8 of 60
Wind turbines per 100 km² (OpenStreetMap) (2026)2.6 100 km²3.9 100 km²0.1 100 km²ranked 9 of 59
Area of mapped solar power plants (OpenStreetMap) (2026)38.7 ha86.7 ha2,381 haranked 17 of 60

Climate

IndicatorJurbarkas District MunicipalityTauragė CountyNationalPosition?Rank
Average annual air temperature (1991–2020 normal, estimate) (1991-2020)7.5 °C7.5 °C7.5 °Cranked 23 of 60
Average air temperature in January (1991–2020 normal, estimate) (1991-2020)−2.8 °C−2.5 °C−2.8 °Cranked 20 of 60
Average air temperature in July (1991–2020 normal, estimate) (1991-2020)18.3 °C18.2 °C18.3 °Cranked 30 of 60
Annual precipitation (1991–2020 normal, estimate) (1991-2020)669 mm700 mm666 mmranked 28 of 60
Days per year with at least 1 cm of snowfall (1991–2020 normal, estimate) (1991-2020)22 days2323ranked 34 of 60
Heating degree days, base 18 °C (1991–2020 normal, estimate) (1991-2020)3,850 °C·d3,840 °C·d3,889 °C·dranked 36 of 60
Change in average annual temperature: 1991–2020 compared with 1951–1980 (estimate) (1951-2020)1.3 °C1.3 °C1.3 °Cranked 7 of 60
Average cloud cover (1991–2020 normal, estimate) (1991-2020)69%69%70%ranked 42 of 60
Clear days per year, when average cloud cover was below 20% (1991–2020 normal, estimate) (1991-2020)27 days2726ranked 10 of 60
Days per year with average cloud cover above 80% (1991–2020 normal, estimate) (1991-2020)166 days162168ranked 37 of 60
Average relative air humidity (1991–2020 normal, estimate) (1991-2020)80%80%80%ranked 11 of 60
Frost days per year, when the lowest hourly temperature was below 0 °C (1991–2020 normal, estimate) (1991-2020)110 days108110ranked 30 of 60
Ice days per year, when the highest hourly temperature was below 0 °C (1991–2020 normal, estimate) (1991-2020)44 days4347ranked 47 of 60
Days per year with at least 10 mm of precipitation (1991–2020 normal, estimate) (1991-2020)14 days1513ranked 13 of 60
Maximum daily precipitation total in the year (1991–2020 normal, estimate) (1991-2020)30 mm27 mm28 mmranked 3 of 60
Length of the growing season: from 6 days with average daily temperature above 5 °C to 6 days below 5 °C (1991–2020 normal, estimate) (1991-2020)208 days210204ranked 23 of 60
Precipitation in June, July and August (1991–2020 normal, estimate) (1991-2020)235 mm235 mm234 mmranked 25 of 60
Precipitation in December, January and February (1991–2020 normal, estimate) (1991-2020)138 mm152 mm131 mmranked 13 of 60
Annual snowfall water equivalent (1991–2020 normal, estimate) (1991-2020)103 mm106 mm104 mmranked 34 of 60
Share of snow in annual precipitation (1991–2020 normal, estimate) (1991-2020)15%15%16%ranked 43 of 60
Days per year with at least 5 cm of snowfall (1991–2020 normal, estimate) (1991-2020)2.2 days2.42.0ranked 18 of 60
Maximum 5-day precipitation total in the year (1991–2020 normal, estimate) (1991-2020)55 mm54 mm54 mmranked 14 of 60
Average annual soil temperature at 0–7 cm depth (1991–2020 normal, estimate) (1991-2020)8.0 °C8.0 °C7.7 °Cranked 10 of 60
Days per year when the average soil temperature was below 0 °C (1991–2020 normal, estimate) (1991-2020)66 days6674ranked 50 of 60
Days per year when the average soil temperature reached at least 10 °C (1991–2020 normal, estimate) (1991-2020)156 days155152ranked 8 of 60
Annual solar radiation on a horizontal surface (1991–2020 normal, estimate) (1991-2020)1,035 kWh/m²1,044 kWh/m²1,022 kWh/m²ranked 18 of 60
Solar radiation on a horizontal surface in June, July and August (1991–2020 normal, estimate) (1991-2020)459 kWh/m²463 kWh/m²457 kWh/m²ranked 15 of 60
Solar radiation on a horizontal surface in December, January and February (1991–2020 normal, estimate) (1991-2020)64 kWh/m²64 kWh/m²61 kWh/m²ranked 14 of 60
Mean daily maximum air temperature (1991–2020 normal, estimate) (1991-2020)11.1 °C11.0 °C10.8 °Cranked 11 of 60
Mean daily minimum air temperature (1991–2020 normal, estimate) (1991-2020)3.8 °C3.9 °C3.8 °Cranked 29 of 60
Mean daily temperature range: daily maximum minus daily minimum (1991–2020 normal, estimate) (1991-2020)7.2 °C7.0 °C7.0 °Cranked 1 of 60
Average wind speed at 10 m height (1991–2020 normal, estimate) (1991-2020)3.8 m/s3.7 m/s3.6 m/sranked 9 of 60
Days per year with wind gusts of at least 15 m/s (1991–2020 normal, estimate) (1991-2020)34 days3634ranked 29 of 60
Average wind speed at 100 m height (1991–2020 normal, estimate) (1991-2020)6.4 m/s6.4 m/s6.2 m/sranked 11 of 60
Average wind power density at 100 m height (1991–2020 normal, estimate) (1991-2020)254 W/m²251 W/m²228 W/m²ranked 11 of 60
Mean annual temperature (estimate) (1991-2020)7.7 °C–7.5 °Cranked 17 of 60
Mean temperature of the warmest month (estimate) (1991-2020)18.4 °C–18.4 °Cranked 23 of 60
Mean temperature of the coldest month (estimate) (1991-2020)−2.6 °C–−2.8 °Cranked 15 of 60
Frost days per year (minimum below 0 °C, estimate) (1991-2020)109–110ranked 36 of 60
Annual precipitation (estimate) (1991-2020)669 mm–666 mmranked 27 of 60
Heating degree days per year (base 18 °C, estimate) (1991-2020)3,804–3,884ranked 42 of 60
Cooling degree days per year (base 21 °C, estimate) (1991-2020)11–10ranked 21 of 60

Economy

IndicatorJurbarkas District MunicipalityTauragė CountyNationalPosition?Rank
Registered legal entities (2024)9223,571186,598ranked 36 of 60
Registered legal entities per 1,000 inhabitants (2024)36.3 ‰39.5 ‰42.0 ‰ranked 45 of 60
Registered companies (excluding individual enterprises) (2024)5392,289140,267ranked 38 of 60
Registered companies per 1,000 inhabitants (2024)21.2 ‰25.3 ‰27.4 ‰ranked 48 of 60
Companies registered during the year per 1,000 inhabitants (2024)2.2 ‰2.1 ‰2.2 ‰ranked 31 of 60
Share of companies registered in the last five years (2024)38.8%34.0%39.1%ranked 33 of 60
Supermarkets (OpenStreetMap) (2026)836994ranked 31 of 60
Supermarkets per 10,000 inhabitants (OpenStreetMap) (2026)3.2 10,000 inh.4.0 10,000 inh.3.4 10,000 inh.ranked 36 of 60
Restaurants, cafés and bars (Overture Maps) (2026)20904,166ranked 36 of 59
Restaurants, cafés and bars per 1,000 inhabitants (Overture Maps) (2026)0.8 per 1,000 inh.1.0 per 1,000 inh.0.9 per 1,000 inh.ranked 39 of 59
Public contract award notices from buyers in the municipality (per year) (2024-2025)8.045.57,031ranked 30 of 60
Public contract award notices from buyers in the municipality (per year, per 1,000 inhabitants) (2024-2025)0.320.500.42ranked 36 of 60
Value of public contracts awarded by buyers in the municipality (per year) (2024-2025)1.19 M EUR12.996,102ranked 40 of 60
Share of works contracts in the award notices of buyers in the municipality (2021-2025)0%11%5%ranked 42 of 51
Share of award notices won by a company in the buyer's own municipality (2024-2025)20%10%9%ranked 7 of 44
Public contracts won by companies in the municipality (per year) (2024-2025)4.520.55,535ranked 34 of 60
Public contracts won by companies in the municipality (per year, per 1,000 inhabitants) (2024-2025)0.180.230.23ranked 36 of 60
Value of public contracts won by companies in the municipality (per year) (2024-2025)1.59 M EUR44.794,537ranked 33 of 60
Share of works contracts in the public contracts won by companies in the municipality (2024-2025)0%18%11%ranked 35 of 48
Shops (OpenStreetMap) (2026)643749,001ranked 31 of 59
Shops per 1,000 inhabitants (OpenStreetMap) (2026)2.5 per 1,000 inh.4.2 per 1,000 inh.2.7 per 1,000 inh.ranked 32 of 59
GDP per capita in the county (county) (2024)16k€16k€19.1k€

Employment

IndicatorJurbarkas District MunicipalityTauragė CountyNationalPosition?Rank
Job vacancies registered with the Employment Service (during the year) (2025)846 positions3,959164,708ranked 40 of 60
Job vacancies registered with the Employment Service per 1,000 inhabitants (during the year) (2025)33.7 positions / 1,000 inh.44.0 positions / 1,000 inh.45.7 positions / 1,000 inh.ranked 46 of 60
Median monthly base salary stated in job vacancies (2025)1,400 €–1,300 €ranked 10 of 60
Share of job vacancy notices with at least one position filled (2025)79.8%80.1%80.5%ranked 34 of 60
Share of job vacancies in the occupational group “Work requiring no qualification” (2025)28.6%23.8%24.0%ranked 11 of 60
Share of job vacancies in the occupational group “Production, technical maintenance” (2025)13.0%13.4%14.0%ranked 36 of 60
Share of job vacancies in the occupational group “Sales, purchasing, marketing” (2025)6.5%8.7%9.1%ranked 49 of 60
Share of job vacancies in the occupational group “Transport, warehousing, communications” (2025)10.6%10.4%9.7%ranked 21 of 60
Share of job vacancies in the occupational group “Hotels, catering, tourism” (2025)7.0%7.9%6.9%ranked 27 of 60
Share of job vacancies in the occupational group “Construction” (2025)10.9%8.6%9.0%ranked 16 of 60
Share of job vacancies in the occupational group “Administration, finance, economics” (2025)2.6%3.4%2.6%ranked 28 of 60
Share of job vacancies in the occupational group “Health care, pharmacy” (2025)1.9%2.4%2.3%ranked 38 of 60
Unemployment rate in the county (aged 15 and over) (county) (2025)5.9%5.9%6.8%

Tourism

IndicatorJurbarkas District MunicipalityTauragė CountyNationalPosition?Rank
Number of accommodation establishments (2024)12 no.57 no.3,035 no.ranked 49 of 60
Number of accommodation establishments per 1,000 inhabitants (2024)0.5 no.0.6 no.0.7 no.ranked 42 of 60
Number of rooms in accommodation establishments (2024)92 no.334 no.35,020 no.ranked 47 of 60
Places (beds) in accommodation establishments (2024)222–476ranked 49 of 60
Places (beds) in accommodation establishments per 1,000 residents (2024)8.7 places / 1,000 residents11.3 places / 1,000 residents14.7 places / 1,000 residentsranked 49 of 60
Average number of places per accommodation establishment (2024)18.5 places / establishment17.9 places / establishment21.6 places / establishmentranked 43 of 60
Share of places in hotels and guest houses (2024)21.2%–30.9%ranked 38 of 56
Share of places in the private accommodation sector (2024)40.1%–32.8%ranked 18 of 59
Share of places in hostels and apartment complexes (2024)38.7%–13.6%ranked 5 of 49
Room occupancy rate in hotels and similar establishments (2024)2.8%–39.5%ranked 55 of 55
Bed (place) occupancy rate in hotels and similar establishments (2024)1.6%–26.1%ranked 55 of 55
Nights spent in accommodation establishments (2024)3,524–19,558ranked 45 of 51
Nights in accommodation establishments per resident (2024)0.1 nights / resident–0.7 nights / residentranked 47 of 51
Share of nights spent by tourists residing abroad (2024)21.6%–20.2%ranked 21 of 44
Share of nights spent by tourists residing in Germany (2024)8.7%–1.3%ranked 2 of 39
Share of nights spent by tourists residing in Poland (2024)2.5%–3.0%ranked 26 of 40
Share of nights spent by tourists residing in Belarus (2024)2.5%–0.4%ranked 11 of 35
Share of nights spent by tourists residing in Latvia (2024)0.4%–1.9%ranked 37 of 41
Share of nights spent by tourists residing in Ukraine (2024)1.7%–1.1%ranked 16 of 40
Share of nights in the private accommodation sector (individual hosts) (2024)49.4%–13.0%ranked 4 of 42

Transport

IndicatorJurbarkas District MunicipalityTauragė CountyNationalPosition?Rank
Road accidents with injuries or deaths in the municipality (2025)10852,802ranked 49 of 60
Road accidents with injuries or deaths per 10,000 inhabitants (annual average) (2021-2025)4.58.78.8ranked 59 of 60
People injured in road accidents per 10,000 inhabitants (annual average) (2021-2025)5.410.610.1ranked 59 of 60
Road deaths in the municipality over 5 years (2021-2025)526689ranked 42 of 60
Road deaths per 100,000 inhabitants per year (2021-2025)4.05.76.2ranked 46 of 60
Share of accidents involving a pedestrian (2021-2025)25.0%21.4%17.9%ranked 15 of 60
Share of accidents involving a cyclist, motorcyclist, moped rider or electric scooter rider (2021-2025)30.4%29.4%28.6%ranked 27 of 60
Share of accidents in the dark (2021-2025)10.7%14.1%17.8%ranked 54 of 60
Share of accidents in which a person at fault was drunk (2021-2025)5.4%6.7%7.2%ranked 46 of 60
Public charging points for electric vehicles (2026)351695,907ranked 30 of 60
Public charging points per 1,000 inhabitants (2026)1.39 ‰1.88 ‰1.42 ‰ranked 31 of 60
Share of fast charging points (50 kW or more) (2026)46.6%34.5%51.7%ranked 37 of 59
Number of public transport stops with departures on a weekday (2026)186–166ranked 20 of 52
Number of public transport stops per 100 km² (2026)12.3 100 km²13.8 100 km²12.6 100 km²ranked 29 of 51
Number of public transport departures on a weekday (2026)2,410–1,855ranked 21 of 52
Number of public transport departures on a weekday per 1,000 inhabitants (2026)96 1,000 inh.82 1,000 inh.66 1,000 inh.ranked 15 of 52
Number of public transport routes departing from the municipality's stops (2026)48–46ranked 22 of 52
Railway stations with passenger train departures (2026)00120ranked 35 of 60
Number of passenger train departures on a weekday (2026)001,622ranked 35 of 60
Sunday departures (as a percentage of weekday departures) (2026)15%21%35%ranked 46 of 52
Bus ticket price per 100 km as the crow flies (median) (2026)12.0 €9.9 €10.2 €ranked 5 of 49

Society

IndicatorJurbarkas District MunicipalityTauragė CountyNationalPosition?Rank
Associations, public institutions, foundations and other non-profit organisations per 1,000 inhabitants (2024)7.2 ‰7.0 ‰7.3 ‰ranked 32 of 60
Number of cultural heritage objects (2026)913498,847ranked 39 of 60
Cultural heritage objects per 10,000 inhabitants (2026)36.2 10,000 inh.38.8 10,000 inh.41.0 10,000 inh.ranked 33 of 60
Cultural heritage objects per 100 km² (2026)6.0 100 km²7.9 100 km²9.5 100 km²ranked 50 of 59
Number of archaeological heritage objects (2026)1067860ranked 36 of 60
Number of sacred heritage objects (2026)1227530ranked 11 of 60
Number of petrol stations (OpenStreetMap) (2026)1041773ranked 21 of 60
Number of petrol stations per 10,000 inhabitants (OpenStreetMap) (2026)4.0 10,000 inh.4.6 10,000 inh.2.9 10,000 inh.ranked 10 of 60
Number of ATMs (OpenStreetMap) (2026)521708ranked 34 of 60
Number of ATMs per 10,000 inhabitants (OpenStreetMap) (2026)2.0 10,000 inh.2.3 10,000 inh.2.1 10,000 inh.ranked 38 of 60
Number of Christian places of worship (OpenStreetMap) (2026)23761,155ranked 19 of 60
Number of Christian places of worship per 10,000 inhabitants (OpenStreetMap) (2026)9.2 10,000 inh.8.4 10,000 inh.7.0 10,000 inh.ranked 16 of 60
Number of children's playgrounds (OpenStreetMap) (2026)7292,126ranked 43 of 60
Number of children's playgrounds per 10,000 inhabitants (OpenStreetMap) (2026)2.8 10,000 inh.3.2 10,000 inh.4.0 10,000 inh.ranked 47 of 60
Number of parks (OpenStreetMap) (2026)1678795ranked 15 of 60
Number of parks per 10,000 inhabitants (OpenStreetMap) (2026)6.4 10,000 inh.8.7 10,000 inh.2.7 10,000 inh.ranked 9 of 60
Number of hillforts (OpenStreetMap) (2026)1638611ranked 14 of 60
Number of hillforts per 100 km² (OpenStreetMap) (2026)1.1 100 km²0.9 100 km²0.9 100 km²ranked 27 of 59
Number of sports pitches (OpenStreetMap) (2026)612205,174ranked 30 of 60
Number of sports pitches per 10,000 inhabitants (OpenStreetMap) (2026)24.3 10,000 inh.24.5 10,000 inh.21.2 10,000 inh.ranked 22 of 60
Number of football pitches per 10,000 inhabitants (OpenStreetMap) (2026)5.2 10,000 inh.4.8 10,000 inh.4.0 10,000 inh.ranked 17 of 60
Number of museums (OpenStreetMap) (2026)717474ranked 21 of 60
Number of museums per 100,000 inhabitants (OpenStreetMap) (2026)27.9 100,000 inh.18.9 100,000 inh.16.2 100,000 inh.ranked 17 of 60
Number of cinemas and theatres (OpenStreetMap) (2026)1793ranked 15 of 60
Number of cinemas and theatres per 100,000 inhabitants (OpenStreetMap) (2026)4.0 100,000 inh.7.8 100,000 inh.0.5 100,000 inh.ranked 23 of 60
Events registered by the police in the municipality (2025)3,91114,557770,764ranked 41 of 60
Events registered by the police per 1,000 inhabitants (annual average) (2023-2025)167.3171.6199.0ranked 53 of 60
Events registered by the police and classified as a criminal offence per 1,000 inhabitants (annual average) (2023-2025)12.469.8912.32ranked 30 of 60
Property-related events (theft, robbery, damage) registered by the police per 1,000 inhabitants (annual average) (2023-2025)23.4527.4830.02ranked 51 of 60
Fraud cases registered by the police per 1,000 inhabitants (annual average) (2025)4.774.875.55ranked 49 of 60
Events against the person registered by the police per 1,000 inhabitants (annual average) (2023-2025)48.6438.7943.33ranked 19 of 60
Domestic violence cases registered by the police per 1,000 inhabitants (annual average) (2023-2025)26.7121.2122.53ranked 17 of 60
Public order events registered by the police per 1,000 inhabitants (annual average) (2023-2025)28.4926.5135.50ranked 45 of 60
Drug-related events registered by the police per 1,000 inhabitants (annual average) (2023-2025)1.001.121.77ranked 53 of 57

Environment

IndicatorJurbarkas District MunicipalityTauragė CountyNationalPosition?Rank
Share of the municipality's area in protected areas (OpenStreetMap) (2026)3.3%7.4%6.2%ranked 40 of 59
Fine particles PM2.5 (annual mean) (2024)8.1 µg/m³8.2 µg/m³7.9 µg/m³ranked 21 of 60
Nitrogen dioxide NO₂ (annual mean) (2024)4.1 µg/m³4.3 µg/m³4.4 µg/m³ranked 42 of 60
Ozone O₃ (93.2nd percentile of daily maximum 8-hour means) (2024)101 µg/m³100 µg/m³102 µg/m³ranked 35 of 60
Average altitude of the area (2021)57 m–102 mranked 50 of 60
Average slope of the terrain (2021)2.5 °–2.7 °ranked 37 of 60
Share of the area with a slope above 15° (2021)0.4%–0.2%ranked 22 of 60
Share of artificial surfaces (built-up land, industry, transport) (2018)2.0%–2.8%ranked 48 of 60
Share of agricultural land (fields, orchards, pastures) (2018)57.8%–58.9%ranked 32 of 60
Share of forest (broad-leaved, coniferous, mixed) (2018)33.9%–28.0%ranked 14 of 60
Share of natural open land (heath, scrub, grassland, bare rock, glaciers) (2018)5.2%–4.8%ranked 22 of 60
Share of wetlands (marshes, peat bogs) (2018)0.1%–0.6%ranked 46 of 60
Share of water surfaces (rivers, lakes, reservoirs, lagoons) (2018)1.0%–1.1%ranked 33 of 60
Sealed soil: average imperviousness density (2018)0.5%–0.7%ranked 46 of 60
Share of land area that is built-up (2020)0.4%0.5%0.6%ranked 50 of 59
Built-up surface per inhabitant (2020)237 m²/inh.251 m²/inh.245 m²/inh.ranked 34 of 60
Increase in built-up surface since 1975 (2020)70%–68%ranked 29 of 60
Increase in built-up surface since 2000 (2020)22%–21%ranked 23 of 60
Share of the municipality's area in national parks, strict reserves and sanctuaries (2026)2.0%2.0%2.0%ranked 28 of 59
Area of national parks, strict reserves and sanctuaries (2026)30.0 km²87.8 km²3,075 km²ranked 25 of 59
Share of the municipality's area in Natura 2000 sites (2026)19.2%17.4%9.8%ranked 10 of 59

Health

IndicatorJurbarkas District MunicipalityTauragė CountyNationalPosition?Rank
Hospital beds in the municipality (2023)160 beds47927,800ranked 22 of 59
Hospital beds in the municipality per 1,000 inhabitants (2023)6.5 beds / 1,000 inh.5.3 beds / 1,000 inh.5.1 beds / 1,000 inh.ranked 14 of 59
Acute-care hospital beds in the municipality per 1,000 inhabitants (2023)3.1 beds / 1,000 inh.2.5 beds / 1,000 inh.2.1 beds / 1,000 inh.ranked 13 of 59
Inpatient hospital facilities (2023)1 facilities5133ranked 25 of 59
Hospital admissions per year in the municipality's hospitals (2023)3,335 admissions12,608899,576ranked 25 of 59
Acute-care bed occupancy rate (2023)59.6%–65.9%ranked 31 of 47
Average length of stay in acute-care beds (2023)5.4 days4.85.6ranked 26 of 47
Acute-care bed turnover (patients per bed per year) (2023)40.0 patients / bed–43.8 patients / bedranked 28 of 47
In-hospital case fatality in acute-care beds (deaths among discharges and deaths) (2023)4.55%3.69%4.01%ranked 16 of 47
Crude death rate (deaths per 1,000 inhabitants) (2025)16.4 ‰15.7 ‰15.6 ‰ranked 26 of 60
Crude death rate, 3-year average 2023–2025 (deaths per 1,000 inhabitants) (2023-2025)16.4 ‰15.2 ‰15.2 ‰ranked 24 of 60
Pharmacies (OpenStreetMap) (2026)1232736ranked 11 of 59
Pharmacies per 10,000 inhabitants (OpenStreetMap) (2026)4.8 per 10,000 inh.3.6 per 10,000 inh.2.4 per 10,000 inh.ranked 5 of 59

Education

IndicatorJurbarkas District MunicipalityTauragė CountyNationalPosition?Rank
Schools (OpenStreetMap) (2026)17611,084ranked 19 of 59
Schools per 10,000 inhabitants (OpenStreetMap) (2026)6.8 per 10,000 inh.6.8 per 10,000 inh.4.8 per 10,000 inh.ranked 9 of 59
Pre-school establishments (nurseries, kindergartens, school-kindergartens) (2025)3–7ranked 49 of 58
Pre-school establishments per 1,000 children under 15 (2025)1.1 per 1,000 children under 15–2.4 per 1,000 children under 15ranked 54 of 58
General education schools (primary, basic, progymnasia, gymnasia) (2025)13361,021ranked 26 of 60
General education schools per 1,000 children under 15 (2025)4.8 per 1,000 children under 15–3.1 per 1,000 children under 15ranked 9 of 60
Vocational training establishments (2025)13117ranked 22 of 60
Non-formal children's education schools (music, arts, sports, etc.) (2025)17440ranked 53 of 60
Non-formal children's education schools per 1,000 children under 15 (2025)0.4 per 1,000 children under 15–1.0 per 1,000 children under 15ranked 56 of 60

Risks

IndicatorJurbarkas District MunicipalityTauragė CountyNationalPosition?Rank
Number of civil protection sirens (2026)21611,180ranked 17 of 60
Civil protection sirens per 10,000 residents (2026)8.4 / 10,000 residents6.8 / 10,000 residents4.7 / 10,000 residentsranked 12 of 60
Civil protection sirens per 100 km² (2026)1.4 / 100 km²1.4 / 100 km²1.4 / 100 km²ranked 29 of 59
Number of shelters (2026)561176,584ranked 25 of 60
Shelters per 10,000 residents (2026)22.3 / 10,000 residents13.0 / 10,000 residents18.3 / 10,000 residentsranked 23 of 60
Shelter places as a percentage of residents (2026)49%38%42%ranked 23 of 60
Number of collective protection structures (2026)20742,518ranked 41 of 60
Collective protection structures per 10,000 residents (2026)8.0 / 10,000 residents8.2 / 10,000 residents10.3 / 10,000 residentsranked 41 of 60
Collective protection places as a percentage of residents (2026)40%45%41%ranked 34 of 60
Number of evacuation points (2026)37881,960ranked 18 of 60
Evacuation points per 10,000 residents (2026)14.7 / 10,000 residents9.8 / 10,000 residents9.1 / 10,000 residentsranked 19 of 60
Fire and rescue service incidents (fires, rescues and others) per 1,000 residents (2025)9.0 / 1,000 residents10.8 / 1,000 residents11.2 / 1,000 residentsranked 47 of 58
Number of fires (2025)53–87ranked 47 of 58
Fires per 1,000 residents (2025)2.1 / 1,000 residents2.7 / 1,000 residents2.9 / 1,000 residentsranked 47 of 58
Fires per 1,000 residents a year, average 2021-2025 (2021-2025)2.8 / 1,000 residents a year3.3 / 1,000 residents a year3.4 / 1,000 residents a yearranked 42 of 58
Share of fires in grass, hay, forest litter and peat (2021-2025)20.4%18.2%18.4%ranked 21 of 58
Share of fires in waste and rubbish (2021-2025)6.8%8.9%12.3%ranked 54 of 58
Share of chimney and stove fires (2021-2025)24.6%21.5%17.0%ranked 9 of 58
Share of vehicle fires (2021-2025)5.4%6.0%4.2%ranked 14 of 58
Share of fires in electrical wiring and appliances (2021-2025)2.0%3.4%3.0%ranked 39 of 58
Fire deaths per 100,000 residents a year, average 2016-2025 (2016-2025)3.1 / 100,000 residents a year2.4 / 100,000 residents a year3.9 / 100,000 residents a yearranked 36 of 58
Structures destroyed by fire per 10,000 residents a year, average 2021-2025 (2021-2025)1.1 / 10,000 residents a year1.0 / 10,000 residents a year0.8 / 10,000 residents a yearranked 18 of 58
Land area exposed to river flooding (1-in-10-year flood) (2024)1.8%4.5%1.2%ranked 22 of 57
Land area exposed to river flooding (1-in-100-year flood) (2024)2.5%5.4%1.8%ranked 22 of 57
Land area exposed to river flooding (1-in-500-year flood) (2024)2.8%5.7%2.1%ranked 22 of 57
Land area under more than 1 m of water in a 1-in-100-year river flood (2024)2.0%4.2%1.1%ranked 18 of 57
Seismic hazard: peak ground acceleration (10 % in 50 years) (2020)0.0088 g0.0101 g0.0075 granked 25 of 60

Jurbarkas District Municipality: indicators over time

Indicators available for several years. Hover over or tap a chart to read the value for each year.

Average annual air temperature (1991–2020 normal, estimate)

+1.8 °C

8.5 °C in 2025, compared with 6.7 °C in 1951

468102025201320011989197719651951
Average annual air temperature (1991–2020 normal, estimate) (°C), 1951–2025

Annual precipitation (1991–2020 normal, estimate)

+201 mm+38.1%

728 mm in 2025, compared with 527 mm in 1951

4006008001,000202520121999198619731951
Annual precipitation (1991–2020 normal, estimate) (mm), 1951–2025

Days per year with at least 1 cm of snowfall (1991–2020 normal, estimate)

−17 days−60.7%

11 days in 2025, compared with 28 days in 1951

02040602025201320011989197719651951
Days per year with at least 1 cm of snowfall (1991–2020 normal, estimate) (days), 1951–2025

Heating degree days, base 18 °C (1991–2020 normal, estimate)

−718 °C·d−17.3%

3,443 °C·d in 2025, compared with 4,161 °C·d in 1951

3,0004,0005,000202520121999198619731951
Heating degree days, base 18 °C (1991–2020 normal, estimate) (°C·d), 1951–2025

Average cloud cover (1991–2020 normal, estimate)

+8.0 pp

69% in 2025, compared with 61% in 1951

6070802025201320011989197719651951
Average cloud cover (1991–2020 normal, estimate) (%), 1951–2025

Clear days per year, when average cloud cover was below 20% (1991–2020 normal, estimate)

−27 days−57.4%

20 days in 2025, compared with 47 days in 1951

02040602025201320011989197719651951
Clear days per year, when average cloud cover was below 20% (1991–2020 normal, estimate) (days), 1951–2025

Days per year with average cloud cover above 80% (1991–2020 normal, estimate)

+20 days+14.9%

154 days in 2025, compared with 134 days in 1951

1001502002502025201320011989197719651951
Days per year with average cloud cover above 80% (1991–2020 normal, estimate) (days), 1951–2025

Average relative air humidity (1991–2020 normal, estimate)

+3.0 pp

81% in 2025, compared with 78% in 1951

76788082842025201320011989197719651951
Average relative air humidity (1991–2020 normal, estimate) (%), 1951–2025

Frost days per year, when the lowest hourly temperature was below 0 °C (1991–2020 normal, estimate)

−39 days−30.7%

88 days in 2025, compared with 127 days in 1951

501001502002025201320011989197719651951
Frost days per year, when the lowest hourly temperature was below 0 °C (1991–2020 normal, estimate) (days), 1951–2025

Ice days per year, when the highest hourly temperature was below 0 °C (1991–2020 normal, estimate)

−29 days−58.0%

21 days in 2025, compared with 50 days in 1951

0501001502025201320011989197719651951
Ice days per year, when the highest hourly temperature was below 0 °C (1991–2020 normal, estimate) (days), 1951–2025

Days per year with at least 10 mm of precipitation (1991–2020 normal, estimate)

+8 days+100.0%

16 days in 2025, compared with 8 days in 1951

01020302025201320011989197719651951
Days per year with at least 10 mm of precipitation (1991–2020 normal, estimate) (days), 1951–2025

Maximum daily precipitation total in the year (1991–2020 normal, estimate)

+4 mm+16.0%

29 mm in 2025, compared with 25 mm in 1951

0204060802025201320011989197719651951
Maximum daily precipitation total in the year (1991–2020 normal, estimate) (mm), 1951–2025

Length of the growing season: from 6 days with average daily temperature above 5 °C to 6 days below 5 °C (1991–2020 normal, estimate)

+83 days+48.0%

256 days in 2025, compared with 173 days in 1951

1502002503002025201320011989197719651951
Length of the growing season: from 6 days with average daily temperature above 5 °C to 6 days below 5 °C (1991–2020 normal, estimate) (days), 1951–2025

Precipitation in June, July and August (1991–2020 normal, estimate)

+164 mm+118.8%

302 mm in 2025, compared with 138 mm in 1951

01002003004002025201320011989197719651951
Precipitation in June, July and August (1991–2020 normal, estimate) (mm), 1951–2025

Precipitation in December, January and February (1991–2020 normal, estimate)

−52 mm−33.8%

102 mm in 2025, compared with 154 mm in 1951

01002003002025201320011989197719651951
Precipitation in December, January and February (1991–2020 normal, estimate) (mm), 1951–2025

Annual snowfall water equivalent (1991–2020 normal, estimate)

−80 mm−58.4%

57 mm in 2025, compared with 137 mm in 1951

01002003002025201320011989197719651951
Annual snowfall water equivalent (1991–2020 normal, estimate) (mm), 1951–2025

Share of snow in annual precipitation (1991–2020 normal, estimate)

−18.0 pp

8% in 2025, compared with 26% in 1951

0102030402025201320011989197719651951
Share of snow in annual precipitation (1991–2020 normal, estimate) (%), 1951–2025

Days per year with at least 5 cm of snowfall (1991–2020 normal, estimate)

−2.0 days−66.7%

1.0 days in 2025, compared with 3.0 days in 1951

05102025201320011989197719651951
Days per year with at least 5 cm of snowfall (1991–2020 normal, estimate) (days), 1951–2025

Maximum 5-day precipitation total in the year (1991–2020 normal, estimate)

+27 mm+79.4%

61 mm in 2025, compared with 34 mm in 1951

2550751002025201320011989197719651951
Maximum 5-day precipitation total in the year (1991–2020 normal, estimate) (mm), 1951–2025

Average annual soil temperature at 0–7 cm depth (1991–2020 normal, estimate)

+1.0 °C

8.7 °C in 2025, compared with 7.6 °C in 1951

68102025201320011989197719651951
Average annual soil temperature at 0–7 cm depth (1991–2020 normal, estimate) (°C), 1951–2025

Days per year when the average soil temperature was below 0 °C (1991–2020 normal, estimate)

−58 days−58.0%

42 days in 2025, compared with 100 days in 1951

0501001502025201320011989197719651951
Days per year when the average soil temperature was below 0 °C (1991–2020 normal, estimate) (days), 1951–2025

Days per year when the average soil temperature reached at least 10 °C (1991–2020 normal, estimate)

+5 days+3.4%

150 days in 2025, compared with 145 days in 1951

1201401601802025201320011989197719651951
Days per year when the average soil temperature reached at least 10 °C (1991–2020 normal, estimate) (days), 1951–2025

Annual solar radiation on a horizontal surface (1991–2020 normal, estimate)

−74 kWh/m²−6.7%

1,029 kWh/m² in 2025, compared with 1,103 kWh/m² in 1951

9001,0001,1001,200202520121999198619731951
Annual solar radiation on a horizontal surface (1991–2020 normal, estimate) (kWh/m²), 1951–2025

Solar radiation on a horizontal surface in June, July and August (1991–2020 normal, estimate)

−59 kWh/m²−11.7%

445 kWh/m² in 2025, compared with 504 kWh/m² in 1951

3504004505005502025201320011989197719651951
Solar radiation on a horizontal surface in June, July and August (1991–2020 normal, estimate) (kWh/m²), 1951–2025

Solar radiation on a horizontal surface in December, January and February (1991–2020 normal, estimate)

−5 kWh/m²−7.5%

62 kWh/m² in 2025, compared with 67 kWh/m² in 1951

506070802025201320011989197719651951
Solar radiation on a horizontal surface in December, January and February (1991–2020 normal, estimate) (kWh/m²), 1951–2025

Mean daily maximum air temperature (1991–2020 normal, estimate)

+2.0 °C

12.2 °C in 2025, compared with 10.2 °C in 1951

81012142025201320011989197719651951
Mean daily maximum air temperature (1991–2020 normal, estimate) (°C), 1951–2025

Mean daily minimum air temperature (1991–2020 normal, estimate)

+1.6 °C

5.0 °C in 2025, compared with 3.4 °C in 1951

02462025201320011989197719651951
Mean daily minimum air temperature (1991–2020 normal, estimate) (°C), 1951–2025

Mean daily temperature range: daily maximum minus daily minimum (1991–2020 normal, estimate)

+0.4 °C

7.2 °C in 2025, compared with 6.8 °C in 1951

6782025201320011989197719651951
Mean daily temperature range: daily maximum minus daily minimum (1991–2020 normal, estimate) (°C), 1951–2025

Average wind speed at 10 m height (1991–2020 normal, estimate)

0.0 m/s−1.3%

3.7 m/s in 2025, compared with 3.8 m/s in 1951

3.503.754.004.252025201320011989197719651951
Average wind speed at 10 m height (1991–2020 normal, estimate) (m/s), 1951–2025

Days per year with wind gusts of at least 15 m/s (1991–2020 normal, estimate)

+4 days+17.4%

27 days in 2025, compared with 23 days in 1951

02040602025201320011989197719651951
Days per year with wind gusts of at least 15 m/s (1991–2020 normal, estimate) (days), 1951–2025

Average wind speed at 100 m height (1991–2020 normal, estimate)

−0.2 m/s−2.8%

6.2 m/s in 2025, compared with 6.4 m/s in 1951

5.56.06.57.02025201320011989197719651951
Average wind speed at 100 m height (1991–2020 normal, estimate) (m/s), 1951–2025

Average wind power density at 100 m height (1991–2020 normal, estimate)

−24 W/m²−9.4%

231 W/m² in 2025, compared with 255 W/m² in 1951

2002503003502025201320011989197719651951
Average wind power density at 100 m height (1991–2020 normal, estimate) (W/m²), 1951–2025

Mean annual temperature (estimate)

+2.1 °C

8.7 °C in 2025, compared with 6.6 °C in 1950

468102025201320011989197719651950
Mean annual temperature (estimate) (°C), 1950–2025

Frost days per year (minimum below 0 °C, estimate)

−23−21.3%

85 in 2025, compared with 108 in 1950

501001502025201320011989197719651950
Frost days per year (minimum below 0 °C, estimate), 1950–2025

Annual precipitation (estimate)

−62 mm−7.8%

728 mm in 2025, compared with 790 mm in 1950

4006008001,000202520121999198619731950
Annual precipitation (estimate) (mm), 1950–2025

Public contract award notices from buyers in the municipality (per year)

+9.0+450.0%

11.0 in 2025, compared with 2.0 in 2021

05101520252024202320222021
Public contract award notices from buyers in the municipality (per year), 2021–2025

Job vacancies registered with the Employment Service (during the year)

−175 positions−17.1%

846 positions in 2025, compared with 1,021 positions in 2010

01,0002,0003,000202520222019201620132010
Job vacancies registered with the Employment Service (during the year) (positions), 2010–2025

Job vacancies registered with the Employment Service per 1,000 inhabitants (during the year)

−44.3 positions / 1,000 inh.−56.8%

33.7 positions / 1,000 inh. in 2025, compared with 78.0 positions / 1,000 inh. in 2015

255075100202520232021201920172015
Job vacancies registered with the Employment Service per 1,000 inhabitants (during the year) (positions / 1,000 inh.), 2015–2025

Median monthly base salary stated in job vacancies

+853 €+155.9%

1,400 € in 2025, compared with 547 € in 2018

5001,0001,5002025202320212018
Median monthly base salary stated in job vacancies (€), 2018–2025

Share of job vacancy notices with at least one position filled

+25.3 pp

79.8% in 2025, compared with 54.5% in 2018

506070802025202320212018
Share of job vacancy notices with at least one position filled (%), 2018–2025

Share of job vacancies in the occupational group “Work requiring no qualification”

+19.0 pp

28.6% in 2025, compared with 9.6% in 2018

01020302025202320212018
Share of job vacancies in the occupational group “Work requiring no qualification” (%), 2018–2025

Share of job vacancies in the occupational group “Production, technical maintenance”

+6.5 pp

13.0% in 2025, compared with 6.5% in 2018

5.07.510.012.515.02025202320212018
Share of job vacancies in the occupational group “Production, technical maintenance” (%), 2018–2025

Share of job vacancies in the occupational group “Sales, purchasing, marketing”

−0.1 pp

6.5% in 2025, compared with 6.6% in 2018

2.55.07.510.012.52025202320212018
Share of job vacancies in the occupational group “Sales, purchasing, marketing” (%), 2018–2025

Share of job vacancies in the occupational group “Transport, warehousing, communications”

−29.6 pp

10.6% in 2025, compared with 40.2% in 2018

02040602025202320212018
Share of job vacancies in the occupational group “Transport, warehousing, communications” (%), 2018–2025

Share of job vacancies in the occupational group “Hotels, catering, tourism”

+3.6 pp

7.0% in 2025, compared with 3.4% in 2018

24682025202320212018
Share of job vacancies in the occupational group “Hotels, catering, tourism” (%), 2018–2025

Share of job vacancies in the occupational group “Construction”

−6.4 pp

10.9% in 2025, compared with 17.3% in 2018

5101520252025202320212018
Share of job vacancies in the occupational group “Construction” (%), 2018–2025

Share of job vacancies in the occupational group “Administration, finance, economics”

+1.1 pp

2.6% in 2025, compared with 1.5% in 2018

12342025202320212018
Share of job vacancies in the occupational group “Administration, finance, economics” (%), 2018–2025

Share of job vacancies in the occupational group “Health care, pharmacy”

−1.1 pp

1.9% in 2025, compared with 3.0% in 2018

02462025202320212018
Share of job vacancies in the occupational group “Health care, pharmacy” (%), 2018–2025

Places (beds) in accommodation establishments

+21+10.4%

222 in 2024, compared with 201 in 2019

150175200225250202420232022202120202019
Places (beds) in accommodation establishments, 2019–2024

Places (beds) in accommodation establishments per 1,000 residents

+1.1 places / 1,000 residents+13.8%

8.7 places / 1,000 residents in 2024, compared with 7.7 places / 1,000 residents in 2019

6789202420232022202120202019
Places (beds) in accommodation establishments per 1,000 residents (places / 1,000 residents), 2019–2024

Room occupancy rate in hotels and similar establishments

−15.4 pp

2.8% in 2024, compared with 18.2% in 2013

0102030202420222020201820162013
Room occupancy rate in hotels and similar establishments (%), 2013–2024

Bed (place) occupancy rate in hotels and similar establishments

−15.8 pp

1.6% in 2024, compared with 17.4% in 2013

01020202420222020201820162013
Bed (place) occupancy rate in hotels and similar establishments (%), 2013–2024

Nights spent in accommodation establishments

−3,139−47.1%

3,524 in 2024, compared with 6,663 in 2020

05,00010,00015,0002024202320212020
Nights spent in accommodation establishments, 2020–2024

Nights in accommodation establishments per resident

−0.1 nights / resident−46.2%

0.1 nights / resident in 2024, compared with 0.3 nights / resident in 2020

0.00.20.40.62024202320212020
Nights in accommodation establishments per resident (nights / resident), 2020–2024

Share of nights spent by tourists residing abroad

−6.1 pp

21.6% in 2024, compared with 27.7% in 2020

1020302024202320212020
Share of nights spent by tourists residing abroad (%), 2020–2024

Share of nights spent by tourists residing in Germany

+7.8 pp

8.7% in 2024, compared with 0.9% in 2020

05102024202320212020
Share of nights spent by tourists residing in Germany (%), 2020–2024

Share of nights spent by tourists residing in Poland

−4.1 pp

2.5% in 2024, compared with 6.6% in 2021

2468202420232021
Share of nights spent by tourists residing in Poland (%), 2021–2024

Share of nights spent by tourists residing in Latvia

+0.1 pp

0.4% in 2024, compared with 0.3% in 2021

0.00.51.01.5202420232021
Share of nights spent by tourists residing in Latvia (%), 2021–2024

Share of nights spent by tourists residing in Ukraine

+1.6 pp

1.7% in 2024, compared with 0.1% in 2021

024202420232021
Share of nights spent by tourists residing in Ukraine (%), 2021–2024

Share of nights in hotels and guest houses

+6.9 pp

49.8% in 2023, compared with 42.9% in 2020

42.545.047.550.0202320212020
Share of nights in hotels and guest houses (%), 2020–2023

Share of nights in the private accommodation sector (individual hosts)

−7.7 pp

49.4% in 2024, compared with 57.1% in 2020

4050602024202320212020
Share of nights in the private accommodation sector (individual hosts) (%), 2020–2024

Road accidents with injuries or deaths in the municipality

−11−52.4%

10 in 2025, compared with 21 in 2013

5101520252025202320212019201720152013
Road accidents with injuries or deaths in the municipality, 2013–2025

Road accidents with injuries or deaths per 10,000 inhabitants (annual average)

−1.3−22.7%

4.5 in 2025, compared with 5.8 in 2019

4.04.55.05.56.02025202420232022202120202019
Road accidents with injuries or deaths per 10,000 inhabitants (annual average), 2019–2025

People injured in road accidents per 10,000 inhabitants (annual average)

−1.2−18.5%

5.4 in 2025, compared with 6.7 in 2019

5672025202420232022202120202019
People injured in road accidents per 10,000 inhabitants (annual average), 2019–2025

Road deaths in the municipality over 5 years

−3−37.5%

5 in 2025, compared with 8 in 2017

24681020252023202120192017
Road deaths in the municipality over 5 years, 2017–2025

Road deaths per 100,000 inhabitants per year

−2.6−39.5%

4.0 in 2025, compared with 6.6 in 2019

24682025202420232022202120202019
Road deaths per 100,000 inhabitants per year, 2019–2025

Share of accidents involving a pedestrian

+5.4 pp

25.0% in 2025, compared with 19.6% in 2017

010203020252023202120192017
Share of accidents involving a pedestrian (%), 2017–2025

Share of accidents involving a cyclist, motorcyclist, moped rider or electric scooter rider

+6.5 pp

30.4% in 2025, compared with 23.9% in 2017

2025303520252023202120192017
Share of accidents involving a cyclist, motorcyclist, moped rider or electric scooter rider (%), 2017–2025

Share of accidents in the dark

−13.2 pp

10.7% in 2025, compared with 23.9% in 2017

1015202520252023202120192017
Share of accidents in the dark (%), 2017–2025

Share of accidents in which a person at fault was drunk

−4.6 pp

5.4% in 2025, compared with 10.0% in 2017

2.55.07.510.020252023202120192017
Share of accidents in which a person at fault was drunk (%), 2017–2025

Events registered by the police in the municipality

+43+1.1%

3,911 in 2025, compared with 3,868 in 2019

3,5004,0004,5005,0002025202420232022202120202019
Events registered by the police in the municipality, 2019–2025

Events registered by the police per 1,000 inhabitants (annual average)

−7.7−4.4%

167.3 in 2025, compared with 175.0 in 2021

16017018019020252024202320222021
Events registered by the police per 1,000 inhabitants (annual average), 2021–2025

Events registered by the police and classified as a criminal offence per 1,000 inhabitants (annual average)

−0.34−2.7%

12.46 in 2025, compared with 12.80 in 2021

11.512.012.513.020252024202320222021
Events registered by the police and classified as a criminal offence per 1,000 inhabitants (annual average), 2021–2025

Property-related events (theft, robbery, damage) registered by the police per 1,000 inhabitants (annual average)

+0.98+4.4%

23.45 in 2025, compared with 22.47 in 2023

22.022.523.023.524.0202520242023
Property-related events (theft, robbery, damage) registered by the police per 1,000 inhabitants (annual average), 2023–2025

Events against the person registered by the police per 1,000 inhabitants (annual average)

+1.19+2.5%

48.64 in 2025, compared with 47.45 in 2023

47484950202520242023
Events against the person registered by the police per 1,000 inhabitants (annual average), 2023–2025

Domestic violence cases registered by the police per 1,000 inhabitants (annual average)

+4.81+22.0%

26.71 in 2025, compared with 21.90 in 2021

202224262820252024202320222021
Domestic violence cases registered by the police per 1,000 inhabitants (annual average), 2021–2025

Public order events registered by the police per 1,000 inhabitants (annual average)

−3.65−11.4%

28.49 in 2025, compared with 32.14 in 2022

283032342025202420232022
Public order events registered by the police per 1,000 inhabitants (annual average), 2022–2025

Drug-related events registered by the police per 1,000 inhabitants (annual average)

−0.16−13.8%

1.00 in 2025, compared with 1.16 in 2021

1.01.21.41.620252024202320222021
Drug-related events registered by the police per 1,000 inhabitants (annual average), 2021–2025

Fine particles PM2.5 (annual mean)

−2.8 µg/m³−25.7%

8.1 µg/m³ in 2024, compared with 10.9 µg/m³ in 2018

6810122024202320222021202020192018
Fine particles PM2.5 (annual mean) (µg/m³), 2018–2024

Nitrogen dioxide NO₂ (annual mean)

−0.5 µg/m³−10.9%

4.1 µg/m³ in 2024, compared with 4.6 µg/m³ in 2018

3.54.04.55.02024202320222021202020192018
Nitrogen dioxide NO₂ (annual mean) (µg/m³), 2018–2024

Ozone O₃ (93.2nd percentile of daily maximum 8-hour means)

−5 µg/m³−4.5%

101 µg/m³ in 2024, compared with 106 µg/m³ in 2018

90951001051102024202320222021202020192018
Ozone O₃ (93.2nd percentile of daily maximum 8-hour means) (µg/m³), 2018–2024

Share of artificial surfaces (built-up land, industry, transport)

−0.1 pp

2.0% in 2018, compared with 2.1% in 2000

2.002.052.102018201220062000
Share of artificial surfaces (built-up land, industry, transport) (%), 2000–2018

Share of agricultural land (fields, orchards, pastures)

−1.6 pp

57.8% in 2018, compared with 59.4% in 2000

575859602018201220062000
Share of agricultural land (fields, orchards, pastures) (%), 2000–2018

Share of forest (broad-leaved, coniferous, mixed)

+0.8 pp

33.9% in 2018, compared with 33.1% in 2000

33.033.534.02018201220062000
Share of forest (broad-leaved, coniferous, mixed) (%), 2000–2018

Share of natural open land (heath, scrub, grassland, bare rock, glaciers)

+0.9 pp

5.2% in 2018, compared with 4.3% in 2000

4.04.55.05.52018201220062000
Share of natural open land (heath, scrub, grassland, bare rock, glaciers) (%), 2000–2018

Share of wetlands (marshes, peat bogs)

−0.2 pp

0.1% in 2018, compared with 0.3% in 2000

0.10.20.32018201220062000
Share of wetlands (marshes, peat bogs) (%), 2000–2018

Share of water surfaces (rivers, lakes, reservoirs, lagoons)

+0.1 pp

1.0% in 2018, compared with 0.9% in 2000

0.900.951.002018201220062000
Share of water surfaces (rivers, lakes, reservoirs, lagoons) (%), 2000–2018

Share of land area that is built-up

+0.2 pp

0.4% in 2020, compared with 0.2% in 1975

0.20.30.420202010200019901975
Share of land area that is built-up (%), 1975–2020

Hospital beds in the municipality

−74 beds−31.6%

160 beds in 2023, compared with 234 beds in 2001

150175200225250202320192015201120072001
Hospital beds in the municipality (beds), 2001–2023

Hospital beds in the municipality per 1,000 inhabitants

+0.2 beds / 1,000 inh.+3.5%

6.5 beds / 1,000 inh. in 2023, compared with 6.2 beds / 1,000 inh. in 2015

6.06.57.07.520232021201920172015
Hospital beds in the municipality per 1,000 inhabitants (beds / 1,000 inh.), 2015–2023

Acute-care hospital beds in the municipality per 1,000 inhabitants

0.0 beds / 1,000 inh.−0.9%

3.1 beds / 1,000 inh. in 2023, compared with 3.2 beds / 1,000 inh. in 2015

2.62.83.03.23.420232021201920172015
Acute-care hospital beds in the municipality per 1,000 inhabitants (beds / 1,000 inh.), 2015–2023

Inpatient hospital facilities

−2 facilities−66.7%

1 facilities in 2023, compared with 3 facilities in 2001

123202320192015201120072001
Inpatient hospital facilities (facilities), 2001–2023

Hospital admissions per year in the municipality's hospitals

−3,003 admissions−47.4%

3,335 admissions in 2023, compared with 6,338 admissions in 2001

2,0004,0006,0008,000202320192015201120072001
Hospital admissions per year in the municipality's hospitals (admissions), 2001–2023

Acute-care bed occupancy rate

−17.2 pp

59.6% in 2023, compared with 76.8% in 2001

406080100202320192015201120072001
Acute-care bed occupancy rate (%), 2001–2023

Average length of stay in acute-care beds

−3.0 days−35.3%

5.4 days in 2023, compared with 8.4 days in 2001

56789202320192015201120072001
Average length of stay in acute-care beds (days), 2001–2023

Acute-care bed turnover (patients per bed per year)

+6.6 patients / bed+19.9%

40.0 patients / bed in 2023, compared with 33.3 patients / bed in 2001

20304050202320192015201120072001
Acute-care bed turnover (patients per bed per year) (patients / bed), 2001–2023

In-hospital case fatality in acute-care beds (deaths among discharges and deaths)

+3.05 pp

4.55% in 2023, compared with 1.50% in 2001

0.02.55.07.510.0202320192015201120072001
In-hospital case fatality in acute-care beds (deaths among discharges and deaths) (%), 2001–2023

Crude death rate (deaths per 1,000 inhabitants)

+0.4 ‰+2.5%

16.4 ‰ in 2025, compared with 16.0 ‰ in 1994

101520252025202020152010200520001994
Crude death rate (deaths per 1,000 inhabitants) (‰), 1994–2025

Pre-school establishments (nurseries, kindergartens, school-kindergartens)

0

3 in 2025, compared with 3 in 2010

3.03.54.0202520222019201620132010
Pre-school establishments (nurseries, kindergartens, school-kindergartens), 2010–2025

General education schools (primary, basic, progymnasia, gymnasia)

−6−31.6%

13 in 2025, compared with 19 in 2010

1214161820202520222019201620132010
General education schools (primary, basic, progymnasia, gymnasia), 2010–2025

Vocational training establishments

0

1 in 2025, compared with 1 in 2010

1.01.52.0202520222019201620132010
Vocational training establishments, 2010–2025

Non-formal children's education schools (music, arts, sports, etc.)

0

1 in 2025, compared with 1 in 2010

1.01.52.0202520222019201620132010
Non-formal children's education schools (music, arts, sports, etc.), 2010–2025

Fire and rescue service incidents (fires, rescues and others) per 1,000 residents

−1.4 / 1,000 residents−13.6%

9.0 / 1,000 residents in 2025, compared with 10.4 / 1,000 residents in 2015

8101214202520232021201920172015
Fire and rescue service incidents (fires, rescues and others) per 1,000 residents (/ 1,000 residents), 2015–2025

Number of fires

−56−51.4%

53 in 2025, compared with 109 in 2015

406080100120202520232021201920172015
Number of fires, 2015–2025

Fires per 1,000 residents

−1.7 / 1,000 residents−44.9%

2.1 / 1,000 residents in 2025, compared with 3.8 / 1,000 residents in 2015

2345202520232021201920172015
Fires per 1,000 residents (/ 1,000 residents), 2015–2025

Population of Jurbarkas District Municipality over time

24,00025,00026,00027,00028,00029,000201520172019202120232025
Population, 2015–2025

Jurbarkas District Municipality had 28,429 residents in 2015 and 25,132 in 2025.

YearPopulation
202025,647
202125,174
202224,668
202324,804
202425,421
202525,132

Where is Jurbarkas District Municipality?

The elderships of Jurbarkas District Municipality

The elderships of Jurbarkas District Municipality

Sunshine and temperatures: Jurbarkas District Municipality

Annual solar output
1,008kWh
for 1 kWp tilted at 40°
Warmest month
18.9°C
July
Coldest month
−3.0°C
January
Most productive month
137kWh
May

0100200300−20°−10°0°10°20°30°JanFebMarAprMayJunJulAugSepOctNovDec
Monthly sunshine (kWh/m²)Average temperature (°C)

Solar calculator: how much could you save in Jurbarkas District Municipality?

Estimated output, yearly savings and payback time for Jurbarkas District Municipality. Open the simulation to enter your own figures: the results update as you type.

Output per year
5,040kWh
Savings per year
€700
System cost
€6,000
Payback time
8.6years

These figures are estimates, given for guidance only.

Assumptions

  • Output: 1,008 kWh per kWp per year, panels facing south and tilted at 40°.
  • Electricity price: 0.216 €/kWh in 2026, all taxes included (national average for a household using 2,500 to 5,000 kWh a year).
  • Electricity used on site (40% of the output to begin with) avoids buying power from the grid; the rest is sold at 40% of the purchase price.
  • System cost: €1,200 per kWp to begin with, an indicative figure to replace with a quote.
  • Grants, changes in the electricity price, maintenance and the gradual loss of panel output are not included.
  • Indicative estimate, not a substitute for a study or an installer's quote.
Monthly sunshine (kWh/m²) · Average temperature (°C)
MonthSunshineTemperature
January15−3.0
February32−2.5
March741.4
April1227.4
May16413.1
June17617.1
July16718.9
August13618.1
September9313.7
October488.1
November173.6
December10−0.1

Monthly climate: Jurbarkas District Municipality

Estimated monthly averages over 1991–2020.

Warmest month
18.4°C
July
Coldest month
−2.6°C
January
Rainiest month
87mm
July
Average temperature (°C)−100102030Precipitation (mm)050100JanFebMarAprMayJunJulAugSepOctNovDec
Average temperatureRange from minimum to maximumPrecipitation
Show the values month by month
Monthly climate: Jurbarkas District Municipality · Average 1991–2020
MonthAverage temperature (°C)Minimum temperature (°C)Maximum temperature (°C)Precipitation (mm)
January−2.6−4.9−0.649
February−2.1−4.70.341
March1.4−2.14.941
April7.52.712.141
May12.87.317.653
June16.110.920.672
July18.413.522.987
August17.712.822.576
September13.08.917.354
October7.54.410.758
November2.80.84.749
December−0.8−2.80.948
Year7.63.911.2669

Analyses that mention Jurbarkas District Municipality

Frequently asked questions

What is the population of Jurbarkas District Municipality?

Jurbarkas District Municipality has 25,132 residents (2025), ranking 32 of 60 municipalities.

How big is Jurbarkas District Municipality?

Jurbarkas District Municipality covers 1,507.0 km², with a density of 17 people per km².

Is the population of Jurbarkas District Municipality growing?

Between 2015 and 2025, the population of Jurbarkas District Municipality went from 28,429 to 25,132, a change of −11.6%.

Where is Jurbarkas District Municipality?

Jurbarkas District Municipality is in Tauragė County. Latitude 55.200, longitude 22.917.

Room occupancy rate in hotels and similar establishments: what is the figure for Jurbarkas District Municipality?

In Jurbarkas District Municipality, “Room occupancy rate in hotels and similar establishments” stands at 2.8% (2024), ranking 55 of 55 municipalities; the national median is 39.5%.

Road accidents with injuries or deaths per 10,000 inhabitants (annual average): what is the figure for Jurbarkas District Municipality?

In Jurbarkas District Municipality, “Road accidents with injuries or deaths per 10,000 inhabitants (annual average)” stands at 4.5 (2021-2025), ranking 59 of 60 municipalities; the national median is 8.8.

How much electricity does a solar panel produce in Jurbarkas District Municipality?

In Jurbarkas District Municipality, a 1 kWp south-facing system tilted at 40° produces about 1,008 kWh a year.

Which municipalities border Jurbarkas District Municipality?

The nearest to Jurbarkas District Municipality are Raseiniai District Municipality (25 km), Šakiai District Municipality (32 km), Tauragė District Municipality (41 km), Kelmė District Municipality (52 km), Šilalė District Municipality (57 km).

Coat of arms: Public domain, Wikimedia Commons · Flag: Public domain, Wikimedia Commons. Coats of arms and flags are shown for identification only; this site is not affiliated with any public authority.